Community Data Reports
Healthy Pima works together with state and local agencies to identify and collect current data, statistics, and reports that support Healthy Pima efforts. The list below includes local, state, and national reports that may be of use for examining pertinent community issues and designing, implementing, modifying, and/or funding new projects and/policies.
2019 Arizona Diabetes Action Plan and Report
The Arizona Department of Health Services has released the first comprehensive report highlighting statewide initiatives and the burden of diabetes in Arizona. Building upon the data collected, the report makes recommendations for policies and other actions to address diabetes and improve health.

2018 County Health Rankings Report for Arizona
This report explores the size and nature of health differences by place and race/ethnicity in Arizona and how state and community leaders can take action to create environments where all residents have the opportunity to live their healthiest lives. Specifically, this report will help illuminate:
Differences in Health Outcomes within Arizona by Place and Racial/Ethnic Groups
Differences in Health Factors Within Arizona by Place and Racial/Ethnic Groups
What Pima County and Other Communities Can Do to Create Opportunity and Health for All
Moving With Data to Action
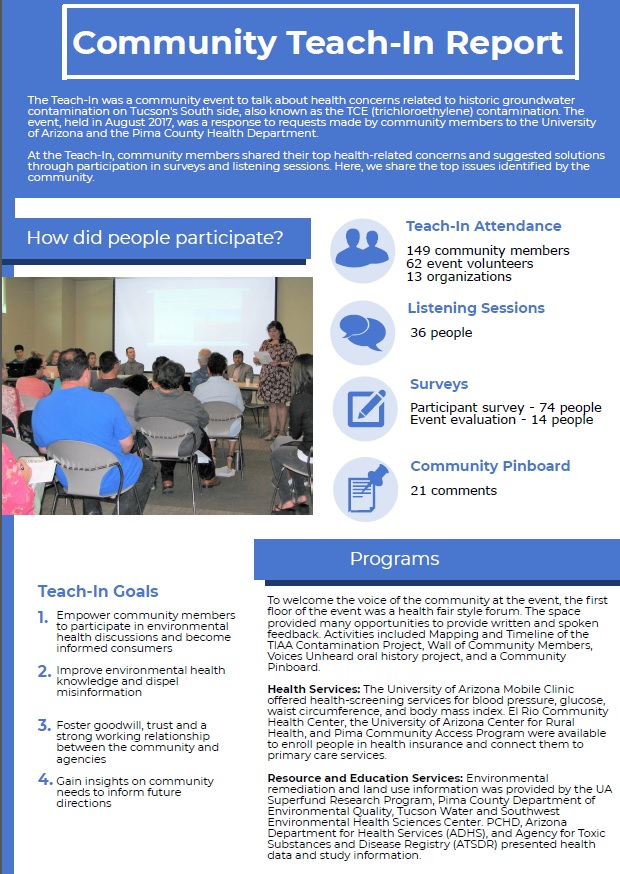
2018 Community Teach-In Report: Groundwater Contamination on Tucson's South Side
Environmental health experts from the University of Arizona Mel and Enid Zuckerman College of Public Health hosted a community teach-in to provide a forum for community members to express health concerns, receive education from experts,and work collaboratively with agencies to address community needs. Read the news article here and the after report here.

2018 Mental Health and Community Development - Volume 13, Issue 1
This issue of the Community Development Innovation Review is dedicated to the topic of mental health and community development. It advances the healthy communities conversation by explicitly recognizing the relationship between mental health and physical health as well as the role social factors play in both aspects of overall well-being. Contents include:
Moving Upstream to Promote Mental Health: The Role of Community Development
The Mental Health Imperative: Learning from History and Innovating Forward
Widening Our Health Lens: Incorporating Trauma-Informed Practice into Affordable Housing
Building a Mental, Emotional, and Behavioral Health “Community of Solution” in Rural Colorado

2018 Place Matters: Access to Food and Health
In Arizona, two main problems – food insecurity and communities with inadequate food retail options- contribute to lack of food access. More than 1 in 10 Arizonans is food insecure, meaning they lack constant, dependable access to enough food for healthy living. In addition, this problem is exacerbated by the fact that many of the communities facing food insecurity are in areas that lack easy access to grocery stores, farmers markets, and other places they might be able to purchase healthy food.
Arizona Partnership for Healthy Communities just launched their “Place Matters” series. In these papers, they identify successful evidence-based practices for improving health outcomes and examine the connections between food access and health.
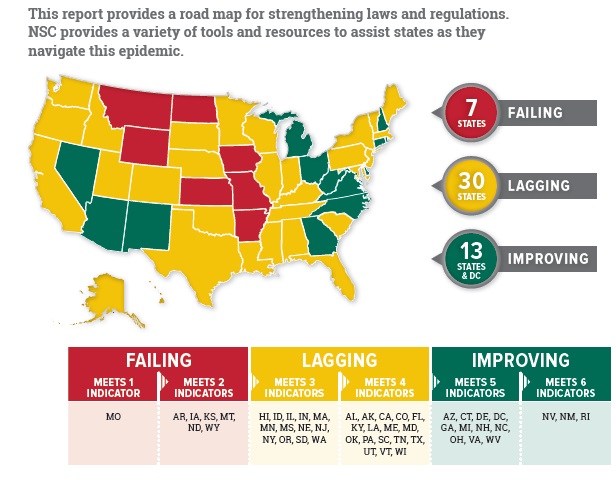
2018 Prescription Nation: Facing America's Opioid Epidemic
NSC experts conducted an extensive review of current literature, state legislation and data to create a comprehensive report on the status of the opioid crisis. The Prescription Nation 2018 report gives you:
A state-by-state comparison of actions taken
Failing-lagging-improving grades for each state
Descriptions of key actions and how they make a difference
What's working in states that have faced the crisis head on
Case studies, success stories and addiction experts' insights
2018 Poverty Reduction Strategies: What Can Tucson Learn from Other Cities
Report developed by UA School of Sociology scholars on potential models for collaborative action, based on the activities of 5 cities across the US.
2018 Arizona Diabetes Burden Report
Report includes Arizona diabetes morbidity and morality rates, diabetes risk factors specific to Arizona, economic and hospitalization impact of diabetes in Arizona, prevention and management efforts and how to get involved.
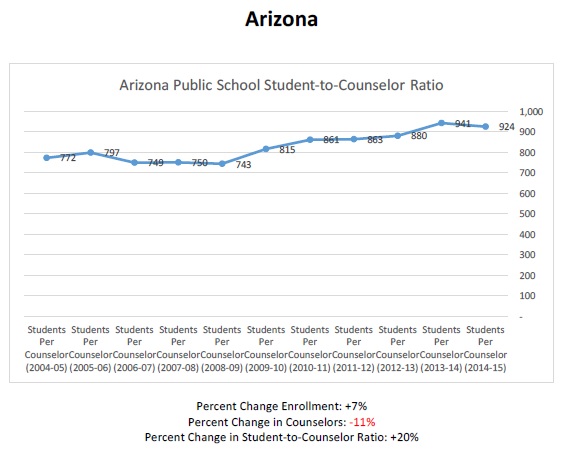
2018 State-by-State Student-to-Counselor Ratio Report: 10-Year Trends
School counselors in American public schools currently serve an average of 482 students, a caseload nearly twice the recommended maximum of 250. The findings highlighted in the report by the National Association for College Admission Counseling (NACAC) and the American School Counselor Association (ASCA) show that the average student-to-school counselor ratio has increased by 1 percent over the past decade. The uptick occurred despite efforts by both organizations to advocate for more state and federal funding to hire, train, and equip school counselors in public schools. The report, which includes state-by-state data, was released in conjunction with National School Counseling Week (#NSCW18).
States with the highest student-to-school counselor ratios included Arizona (924:1), Michigan (729:1), and Minnesota (729:1).
2018 The Future of Health Care: Workforce Development
Resources and gaps identified by participants at the luncheon hosted by the THCC Health Committee on February 15, 2018 to answer the question:"What resources and gaps we see in [Pima County] companies relative to healthcare workers?"
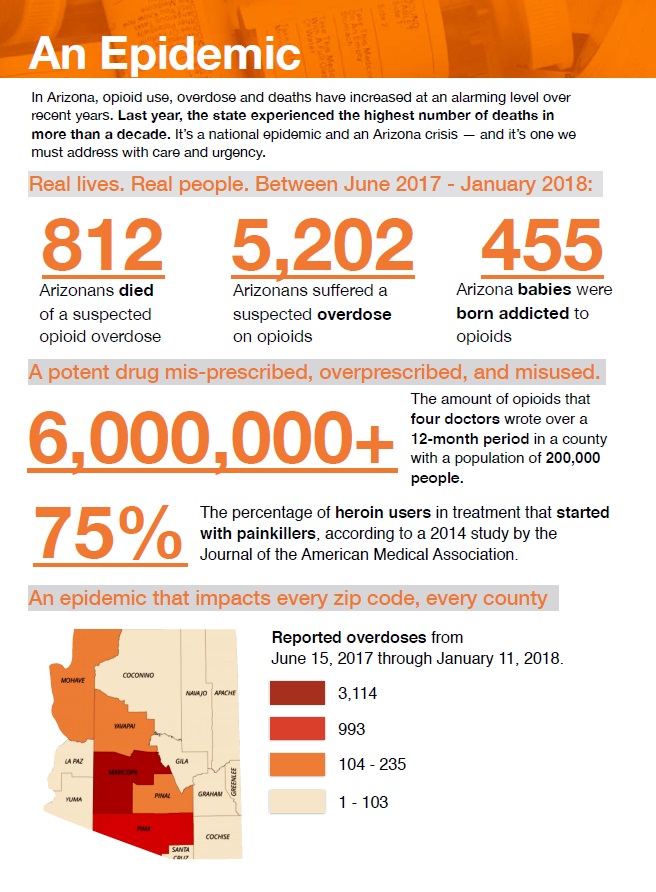
2018 Arizona Opioid Epidemic Act
A packet developed by the Office of the Arizona Governor Doug Ducey that provides an overview of the epidemic, actions to date, the problem/solution with access to treatment, access to naloxone, preventing addiction for Arizona youth, the Good Samaritan Law, the Angel Initiative, and more.
An overview of the Arizona Opioid Epidemic Act Legislation can also be found here: AOMA

2018 Pima County Community Assessment on Refugee Youth
This community assessment was conducted to assess the community's understanding and need around:
Behavioral health gaps and resources for refugee youth
Cultural competency and the refugee experience
Desired training opportunities
Overall findings suggest there is a need and desire for additional training for working with refugee youth across a variety of service providers in Tucson
For more information contact: Ambriel Willer, AmeriCorps.
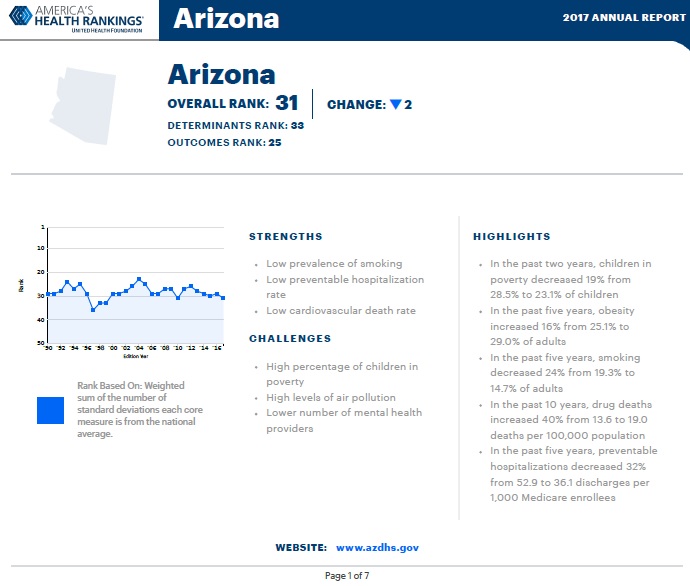
2017 America's Health Rankings
Annual report by the United Health Foundation that provides data (from ADHS) on Arizona health behaviors, policy, clinical care, community and environmental factors. Highlights includes:
In the past two years, children in poverty decreased 19% from 28.5% to 23.1% of children
In the past five years, obesity increased 16% from 25.1% to 29.0% of adults
In the past five years, smoking decreased 24% from 19.3% to 14.7% of adults
In the past 10 years, drug deaths increased 40% from 13.6 to 19.0 deaths per 100,000 population
In the past five years, preventable hospitalizations decreased 32%from 52.9 to 36.1 discharges per 1,000 Medicare enrollees
Additional reports and information can be found at: America's Health Rankings
2017 Arizona Type 2 Diabetes Report
This report contains Tucson-specific data on: (1) percentage of type II diabetes patients ; (2)number of inpatient and outpatient diabetes mellitus cases; (3) charges per inpatient diabetes mellitus case; (4) percentage of type 2 diabetes patients receiving various insulin therapies; and others.
2017 State of Tucson’s Human Service Nonprofit Sector: Service Strengths, Gaps, and Changes in Funding
Report developed by UA School of Sociology scholars that examines the characteristics of the non-profit sector with particular attention towards the types of services being provided, which groups of people are receiving services, and how funding sources might be changing over time. The goal of this white paper is to identify any particular areas of service delivery or need where we might do better as a community to provide for.
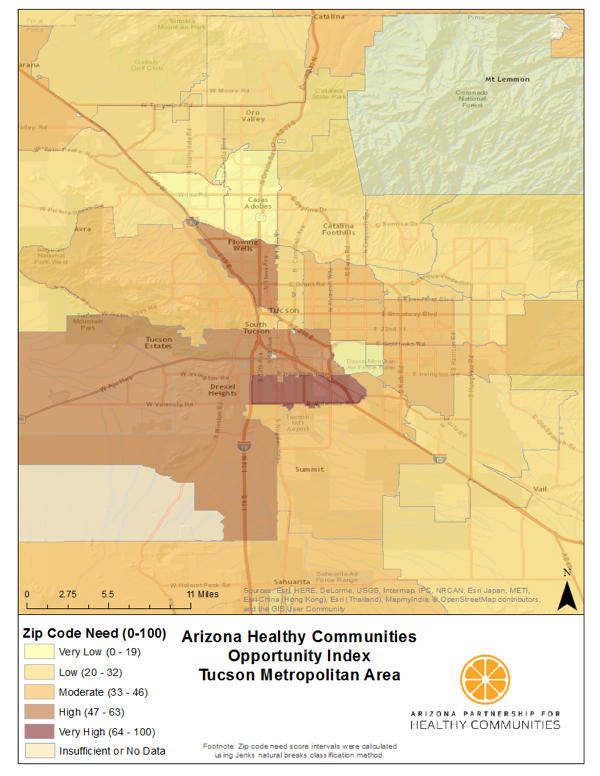
2016 Healthy Communities Opportunity Index
The Arizona Healthy Communities Opportunity Index was created to provide a fuller picture of health disparities across Arizona and to identify areas of opportunity to improve health. Walkability, access to primary care physicians, housing costs, and poverty rates were some of the areas looked across the state.
To create these maps, 15 different data sources were used to gather information for all 403 ZIP codes in Arizona. Data sources were incorporated to capture public health, transportation, housing, and socioeconomic factors in each zip code. In addition to the statewide map, maps were created for the Phoenix and Tucson metro areas.
Find the full report here: AZ Healthy Communities Opportunity Index Report

2016 Arizona Status on Healthy People 2020 Objectives
Reports show Arizona statewide trends (2011-2016) and county profiles (2016) on progress toward Arizona and selected national Year 2020 objectives on:
Maternal, Infant, and Child Health
Responsible Sexual Behavior
Vaccine Preventable Diseases
Injury and Violence
Cancer
Diabetes
Heart Disease and Stroke
Respiratory Diseases
HIV Disease
Substance Abuse

2016 Arizona Motor Vehicle Crash Facts 2016 Highlights
This publication is an annual statistical review of the motor vehicle crashes in the State of Arizona for the calendar year 2016. It includes: (1) Historical trends; (2) Total crashes, fatalities, and injured by county; (3) Driver behavior breakdown; (4) Impaired driving; and more.
2016 Poisonings among Arizona Residents
The data presented in this report show that poisoning is a public health problem that impacts the lives of thousands of Arizona residents each year. These injuries can occur throughout the life span, and like so many injuries, poisonings are preventable. Understanding the circumstances of poisonings is an important step towards educating and empowering communities and implementing prevention strategies.
2016 Falls among Arizonans 65 years and older
Unintentional Falls were the leading cause of injury-related mortality among Arizona residents 65 years and older in 2016, on average accounting for two deaths every day. Preventable falls are costing lives, causing disability and loss of independence, and add a considerable load to our healthcare system.
This report was published by the Arizona Department of Health Services, Arizona Healthy Aging program.
2016 Arizona State Trauma Registry (ASTR): County Trauma Report
The report describes traumatic injury in each of Arizona's 15 counties using the ASTR. Data includes the: (1) rate of traumatic injury; (2) distribution of race/ethnicity-specific trauma rates; and (3) leading mechanisms of trauma - falls, firearms, and others.
2016 Substance Use Among Youth in Pima County
Two-sided handout on substance abuse among youth in Pima County.
Data sources include the Arizona Youth Survey, Medical Examiner's Office, Arizona Department of Health Services Hospital Discharge Data, and others.
For additional information contact: Raul Munoz, Pima County Health Department: Raul.Munoz@pima.gov
2016 Arizona Youth Survey
The Arizona Youth Survey was administered statewide to 8th, 10th, and 12th grade students during spring 2016 to assess the prevalence and frequency of youth substance use, gang involvement, and other risky behaviors, and to better understand the risk and protective factors that are correlated with these behaviors.
Survey highlights can be found on pages 9 and 10.
The data may be of use for examining pertinent community issues and designing, implementing, modifying, and/or funding new projects and/policies.
For additional information contact: Ashley Mully at amully@azcjc.gov
Pima County Office of the Medical Examiner-Forensic Science Center
The Medical Examiner's Office provides annual reports on any death in Pima County that is sudden, violent, unexpected, or in which the cause of death is unknown. Data includes mortality data on suicide, accidents, and overdoses.
Visit the link above and click "Resources/Reports" to view the annual reports from 2010-2016.
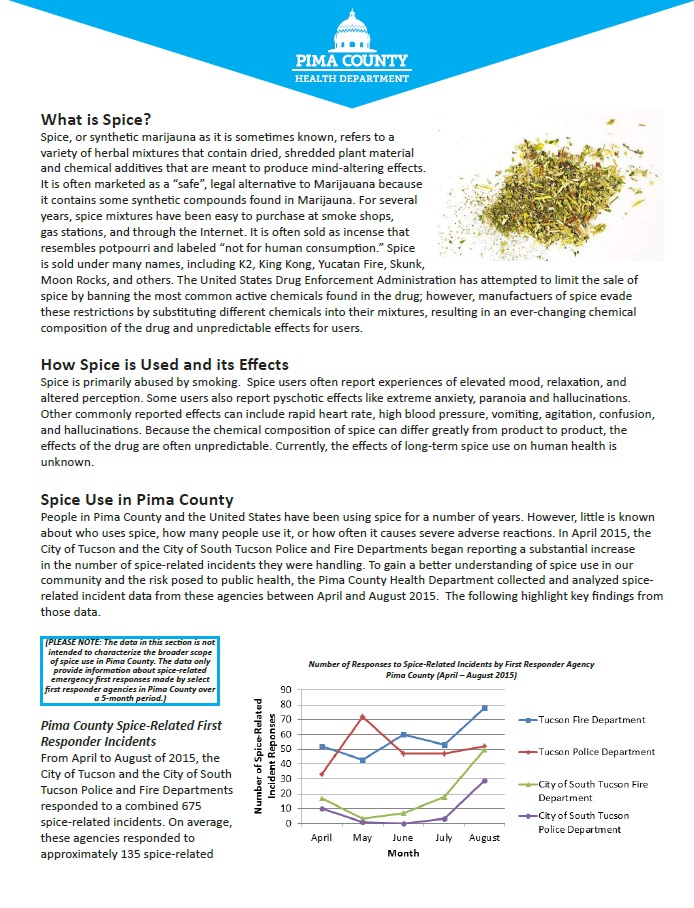
2015 Pima County Spice Fact Sheet
Fact sheet developed by the Pima County Health Department that provides information on: (1) What spice is; (2) How spice is used and its effects; (3) Spice use in Pima County; and (4) Next steps being taken by Pima County Health Department.
2016 Arizona Department of Transportation: Crash Facts
Annual statistical review of the motor vehicle crashes in the State of Arizona for the calendar year 2016. The results are compiled from Arizona Traffic Crash Reports submitted to the Arizona Department of Transportation by state, county, city, tribal, and other law enforcement agencies. Specific Pima County data includes: 1) economic loss due to motor vehicle crashes; 2) number of crashes - fatal and injury; 3) alcohol related crashes; and others.
2015 A Proposal for a Protected Bicycle Route in Tucson, Arizona, Feasibility and Implications for Public Health and Safety.
The idea of implementing a protected bike infrastructure in Tucson is explored in this report. The report focuses on using protected bike lanes to create a low-stress network for bike movement. It also creates a rubric and calibrates it against case-studies in New York City, Chicago, and Washington D.C., to analyze the potential streets in Tucson possess to host protected bike lanes.
Copyright © is held by the author.
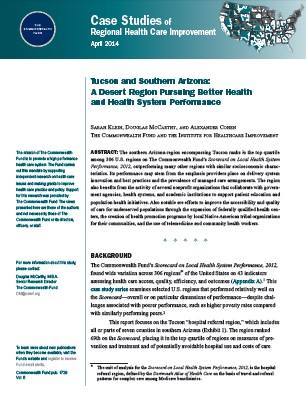
2014 Tucson and Southern Arizona:
A Desert Region Pursuing Better Health and Health System Performance
The southern Arizona region encompassing Tucson ranks in the top quartile among 306 U.S. regions on The Commonwealth Fund’s Scorecard on Local Health System Performance, outperforming many other regions with similar socioeconomic characteristics.
Injury among Residents of Pima County, arizona 2012
Unintentional injury is the leading cause of death among all residents in the state of Arizona, as well as in Pima County.
This report identifies the leading causes of injury among residents of Pima County in 2012 including: (1) causes of unintentional injury-related deaths; (2) causes of unintentional injury-related inpatient hospitalizations; (3) inpatient hospitalizations due to unintentional falls by ages; and others.